
It is the time of the year that everyone is getting comfortable and preparing for the festive days. We see that everyone this year is seeking for ways to make the days around Christmas a bit more colorful. In the Netherlands we are currently limited in receiving 2 guests per day [as per december 2020], which probably means extending Christmas with a 3rd or 4th day. This will will be seen in online shopping actions, like trying to find the right outfit(s) or gifts. My kids really appreciate getting clothes for example. So, even more fashion shopping!
When most people are shopping for a new outfit, they tend to visit a lot of different products and color combinations. In fashion terms this is refered to as cloth scanning. This means that more product pages are being visited. We already know that more products being viewed leads to more products being bought. Optimizing for longer sessions requires predictable session performance. In other words: every view counts! The reason why we scan is because it requires less mental load and we can save our focus for interesting products. This does require all products to appear smoothly when scrolling down or clicking into the details. In other words should strive for a predictable user experience.
The total cognitive load, or amount of mental processing power needed to use your site, affects how easily users find content and complete tasks.
– Kathryn Whitenton
In this article we will be using the MeasureWorks Fashion top-5, to show you what steps it takes to rise from the 5th position up to the number 1. As you can see in the image below, the number 5 on the list is H&M.
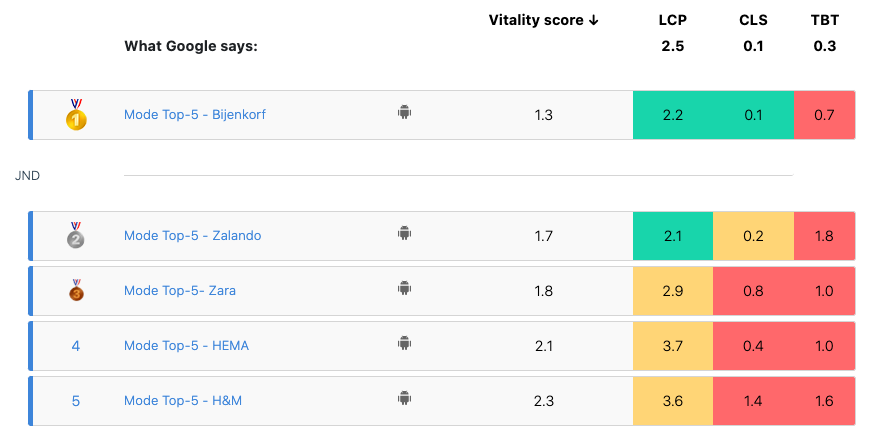
What are recently the fastest fashion websites? Find it out in our Fashion Top 5 benchmark
Beating any competition in 5 easy to follow steps
While the steps and the title sound easy, it isn’t that simple after all. When a site is becoming too complex, there won’t be much easy fixes. Sometimes starting from scratch is easier. The bare minimum is trying to making it as simple as possible again and keep asking yourself the question how much more do we really need. When rebuilding a site or page the steps remain the same, but in that case the 4th step should be focused on setting the right guidelines and frontend architecture upfront.
The 5 steps to become the fastest and beat your competition in web performance are:
- Monitor your pages
- Assess data quality: compare different pages
- Setting performance targets
- Analyzing the loading behavior of the pages
- Get fast, Stay fast!
Step 1: Monitor your pages
The first and foremost step is to monitor your site! In this stage the more the better. Whenever possible I like to advice to enable Real User Monitoring. With this type of monitoring the performance of every user action can be recorded for analysis. Important with this type of monitoring is that it is implemented correctly in order to make the right decisions. So far, I’ve been using a combination of Google Analytics, Chrome Real User Experience Report, Dynatrace, Akamai mPulse, LUX from SpeedCurve and Instana apart from some open-source tools.
Especially with Single Page Applications or Hybrid applications like H&M, some extra effort should be taken in order to have the right page view metrics. When filtering on the product listing page https://www2.hm.com/nl_nl/heren/deals/Multipacks.html for different color patterns the URL is being updated. This is causing a page view to be fired in most tools while the user doesn’t always intend to close the filter section after applying a single filter. Should that be measured as a page view or as a filter action?
The easier method of monitoring is with synthetic tools. This is by far the easiest method of comparing equal pages between competitors. A bunch of different tools can be used all with their pros and cons. Think of PageSpeed insights, WebPageTest or monitoring tools like Rigor, Alertsite, Catchpoint or Dynatrace Synthetics.
For easy benchmarking I like to use WebPageTest and the Chrome Real User Report.
Step 2: Assess data quality: compare different pages
The trouble with monitoring is that it is intended to be correct for a lot of different sites and techniques. Sometimes the tools or a tool in specific can be wrong. That is the reason why I hammer on validating the data before taking actions. While the Web Vitals Benchmark only consists of three metrics there are way more metrics that can be used together for validation.
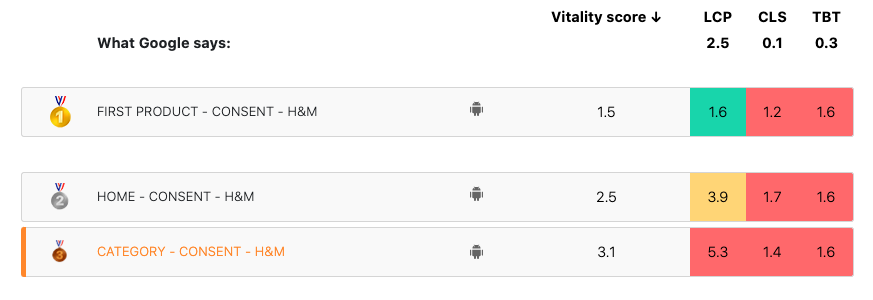
When looking into the individual pages, we notice that the Cumulative Layout Shift (CLS) and Total Blocking Time (TBT) are quite equal but the time to Largest Contentful Paint (LCP) shows a big variation. When there are differences which seems to be too big to be true, it often is too big to be true. In this case the Largest Contentful Paint is not being calculated correct or something is wrong in the testing tool for this page.

When manually looking at the visual loading with the help of the above filmstrip, we can see that the LCP is closer to 6 seconds. The other competitors in the top-5 and the other H&M and pages are being measured as expected. More about this timer and why you should be assessing your measurements can be found here.
We also should compare the homepage between competitors. This is clearly visualizing what we should be working on…eliminating the white.

How to improve your web performance? Read more insights in our free Performance Magazine
Step 3: Setting the performance targets
When optimizing for performance we always set the initial goals based on industry benchmarks, competitive benchmarks and available SLA’s. When looking at SEO performance we have classified the Google Core Web Vitals as SLA for better ranking. The reason for this is simple. If you’re not complying to it, you will be penalized. Just like most SLA’s are written.
When you want to become as fast as the number 1 it is enough to be in a 20% range. This is the case because we are not able to notice differences smaller than 20%. Which means that we need to strive for a Largest Contentful paint of 2.64 seconds with a Cumulative Layout Shift Score of 0.1 and a maximum total blocking time of 840ms (based on the capabilities of a Samsung Galaxy S8).
Step 4: Analyzing the loading behavior of the pages
All H&M pages start with displaying the header and a white screen followed by a fully painted screen. My first assumption would be that we are dealing with a fully client side rendered page or some blocking scripts. Those blocking scripts could be by accident or on purpose for AB testing/ personalization.
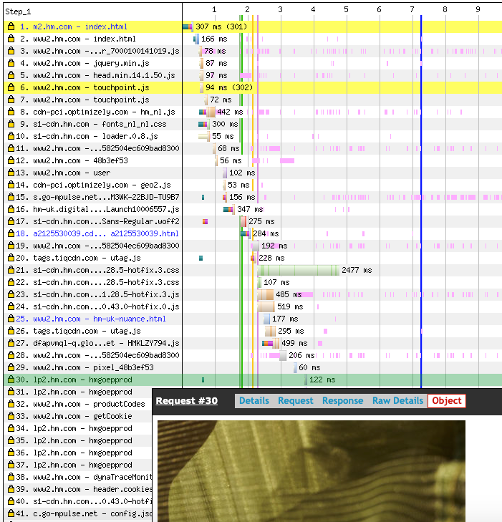
On all of those pages one heavy used AB testing tool is active, and since I’ve seen cases before where the content is blocked until all changes can be applied this is one of the suspects for improvement. Most of the time the experience can already be improved by keeping the implementation clean.

Let’s start by figuring out if the AB testing software is causing the delay.
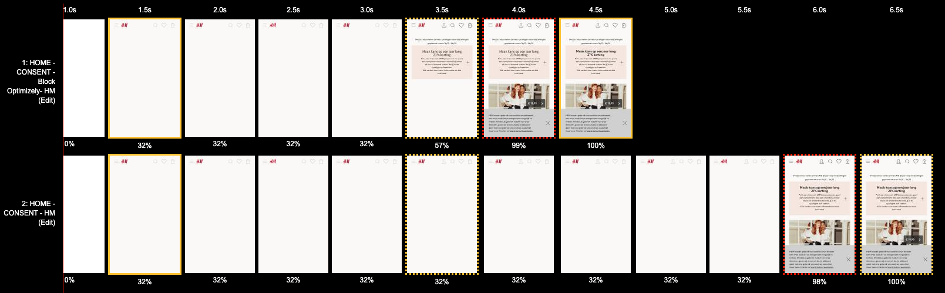
Without the AB testing software, it is already a lot faster, but not as fast as it should be. Exploring the AB testing code reveals that they rely on jQuery for their AB tests. jQuery is loaded synchronously and as we know that it comes with performance costs. In the source of the homepage itself we also see some usage of jQuery. At least jQuery is being reused. The current tests can easily be exchanged for some vanilla JavaScript.
When looking at the script below we can see something else. It seems that the frontend contains some logic which is part of the content publishing suite (CMS).
$(document).ready(function() {
    if (!hm.options.isPublishMode) {
        $('.preshopping-container').show();
    } else {
        $('.preshopping-container').has("article[data-preshopping-teaser=false]").show();
    }
});
We can also see that the hero banner can only be rendered at the client side. A placeholder div is available, but without any styling. It would be better to show an actual placeholder to save the space and shown that something is coming. Then properties are being added to the placeholder div. Once the client-side component scripts have run, those properties are being translated into meaningful html.

The hero content below the statement on the homepage is using background images! Luckily, I already wrote another article about this bad behavior and how to fix it properly from performance perspective.

So far, we’ve learned that it won’t be easy to get from the 5th position to first. This will take some real effort with adoption of the priority model first introduced by The Guardian in 2013 and further refined by me, resulting in the order of loading below.
- Core content (essential html, CSS, JavaScript and images)
- Custom fonts and essential monitoring/ test tools
- Experience enhancement (JavaScript, Full CSS)
- Remainders (Analytics, Ads tags)
- Preparations for next pages
Step 5: Get fast, Stay fast!
Sometimes it will be easy to climb the performance ladder and sometimes things get complicated, like this time with the H&M site. Which means that it requires smart priorization, cultural changes and cooperation with local and global teams. It almost sounds like a performance optimization project ;-). Luckily H&M is already using akamai mPulse for monitoring which means that all the progress can be followed in real time and with the possibility to slice and dice it across devices, countries and so on.
With the right KPI’s, performance budgets and some hard work they can focus on staying fast. Staying fast is highly important in this competitive market with substitute products. When products are equal perceived the difference is made in usability reliability and performance.
Performance is like a Hygiene Factor, everyone expects our website to be fast, but complains when it does not.
-Tom Haveman, https://www.linkedin.com/in/tomhaveman/
How can we help with your performance challenges?
This article is published before on LinkedIn.